Utilizing recirculating aquaculture systems to evaluate the impact of oil toxicity on marine fishes: Design and operation of a large-scale experimental system
For submission to: Marine Technology Society Journal – special issue on C-IMAGE research
Authors:
Kevan L. Main1, Dana L. Wetzel1, Randy Grams1, Michael Nystrom1, Karen Niebuhr2 and Jim Lewis2
1Directorate of Fisheries & Aquaculture, Mote Marine Laboratory
2Complete Water Services, Marietta, Georgia
Abstract:
The long-term damage of oil spills and recovery efforts on wild fishery populations is not well understood. In order to assess potential biological effects of dispersed oil exposure on Gulf of Mexico fishery populations, C-IMAGE (Center for Integrating Modeling and Analysis of the Gulf Ecosystem) consortium scientists examined the sub-lethal impacts from the 2010 Deepwater Horizon oil spill through a combination of field collections and controlled laboratory exposure experiments. Mote Marine Laboratory scientists and Complete Water Services, LLC, (Marietta, GA) engineers partnered to design, develop and operate a large-scale, zero discharge, experimental oil contaminant exposure system at Mote Aquaculture Research Park in Sarasota, Florida. This exposure system is linked to a recirculating aquaculture system (RAS) designed to maintain water quality and water chemistry within acceptable parameters and to remove oil and dispersant from system water during the filtration process. Equipment was sourced to ensure that potential oil co-contaminants were not retained within the system. Water quality (oxygen, pH, salinity, temperature) and chemistry (ammonia, nitrite, nitrate and alkalinity) parameters were monitored and controlled to maintain appropriate environmental conditions for marine fish during experimental trials. The concentrations of petroleum components throughout the system during exposure trials were monitored to ensure that the system was meeting the design parameters. Experimental trials were conducted using the exposure system with three important Gulf of Mexico marine fishes, Florida pompano (Trachinotus carolinus), red drum (Sciaenops ocellatus) and Southern Flounder (Paralichthys lethostigma). These trials examined the impacts of dispersed oil exposure on facets of fish health including: gene expression, transcriptome, immune function, DNA damage, shifts in the microbiome, reproductive potential and success, and the F1 generation from exposed parents. The system was operated successfully through the trials and allowed us to maintain consistent and appropriate water quality conditions in the experimental tanks. The recirculating filtration system successfully maintained water chemistry and removed oil contaminants during the fish exposure trials.
Keywords:
oil contamination, marine fishes, recirculating aquaculture filtration system, water quality
Background:
The Gulf of Mexico Research Initiative (GoMRI) funded C-IMAGE (Center for Integrating Modeling and Analysis of the Gulf Ecosystem) Consortium research is focused on expanding the understanding of the processes, mechanisms, and environmental consequences of marine oil spills through a combination of field-oriented assessments, controlled laboratory experiments, and modeling. In order to assess the biological effects of dispersed oil contamination on Gulf of Mexico fishery populations the Mote Marine Laboratory (MML) research team part of the C-IMAGE Consortium, proposed to carry out a series of controlled experimental studies of adult fish to evaluate the effects of chronic versus episodic dispersed oil exposure on fish health, including gene expression, the transcriptome, immune function, DNA damage, shifts in the microbiome, reproductive potential and success, and the F1 generation from exposed parents
The overarching goal of this effort was to design and operate an aquatic experimental system that allowed us to simulate short- or long-term oil exposure events and thus, investigate the long-term sub-lethal impacts on Gulf fishery populations. The ability to control environmental variables (water quality and chemistry) during the laboratory exposure events was essential to evaluating the impact of the oil exposure on the test species. Examination of the data resulting from the controlled laboratory experiments, together with the data from the field assessments provides a more complete picture of the continuing impact of contamination events on wild fishery populations (Calisi and Bentley, 2009; Briant et al., 2017).
Mote’s Aquaculture Ecosystem Health Research System (AEHRS) design incorporated the following parameters: a multi-tank system with sufficient tank volume to safely house adult fish in treatment tanks, the ability to maintain stable water quality parameters during exposure trials and an independent water filtration system to remove contaminants following exposure and maintain appropriate water chemistry. The ability to expose fish to the desired concentration of dispersed crude oil, remove the compounds associated with the dispersed oil (Varanasi, 1989; Aas et al., 2000) and provide filtered (clean) water to the treatment tanks was incorporated into the AEHRS design.
Methods:
Aquaculture Ecosystem Health Research System (AEHRS) Design
The AEHRS design was based on experimental aquaculture recirculating systems that have been successfully operated for marine fish and fingerling production at Mote Aquaculture Research Park for more than 10 years (Boxman et al., 2015). The water filtration system design was developed by Complete Water Systems, LLC, (Marietta, GA) engineers and Mote’s aquaculture system and fish culture scientists to maintain water quality and water chemistry within acceptable parameters and to remove dispersed oil from system water during the filtration process. Equipment was sourced to ensure that oil co-contaminants were not retained within the system.
Nine exposure tanks were designed to hold up to 10 adult or 30 subadult marine fish (depending on size of the fish species) for 5-28 days. The exposure tank operational volume for the nine fish tanks is 500 L per tank (Figure 1) and the total system volume for the tanks and filtration system is approximately 39,100 L (Figures 1 and 2). Each tank is equipped with a flowmeter to monitor the delivery of oxygen to individual tanks through an oxygen micro-bubble diffuser; therefore, we are able to maintain consistent oxygen levels to support the fish in the tanks during exposure trials. Water inlets are mounted at the top of the tank and outlets at the bottom to ensure adequate mixing of clean water and/or dispersed oil test solutions. Incoming water flow rates are set to 3 L per min, resulting in a tank turnover rate of approximately 2.5 hrs per individual tank. Temperature is controlled in the AEHRS tanks by cycling water through a titanium heat/chill exchange system connected to two individual heater/chiller units (AquaCal®). Tank lighting is controlled by timers and lights are suspended above tanks to provide appropriate conditions for fish and for staff to observe feeding behavior.
The 500-L fiberglass exposure tanks are coated with an isophthalic acid gelcoat (Polycor® 944-series) to prevent adsorption or leaching of oil related hydrocarbons during the exposure trials. The main characteristic of isophthalic acid gelcoat is that it is both resistant to chemicals and atmospheric agents (i.e., UV rays), making this coating suitable for use in many different applications. Prior to constructing the 500-L exposure tanks, a small tank was constructed and coated with the isophthalic acid gelcoat. Water samples were tested to determine if dispersed oil was either adsorbed or leached into tank water. Results indicated that there were no detectable levels of leached oil related compounds found in the tank water when this gelcoat was used.
During experimental trials, dispersed oil is introduced into the individual exposure tanks from two 1300-L oil mixing reservoir, each equipped with a rotating propeller to create the dispersed oil (Corexit 9500 and DWH surrogate oil) test solutions. A third 1300-L header tank was available to provide additional test solutions if the trial required larger volumes of contaminated solution. During the exposure events, clean water or fresh exposure solutions are constantly cycled through the exposure tanks to the water filtration system to maintain required tank turnover rates (Figure 2).
Recirculating filtration system design
The water filtration system includes a series of filters (large and fine solid filters, biofilters, oil filters, and ultraviolet [UV] sterilization filters), water sumps, equalization, transfer and storage tanks to control ammonia concentrations, remove oil and dispersant from the system water, and ensure that adequate water quantities is available to support system water turnover requirements (Figure 2). Water from the exposure tanks is gravity fed through a rotary microscreen drum filter (PR Aqua®) for solids removal and solids are transferred to the waste sump and dried for disposal. Exposure water is then transferred to a collection sump and pumped into a water equalization tank with sufficient volume (9464 L) to ensure that the attached foam fractionator will be continuously running to remove find solids. From the water equalization tank, water is pumped to a small transfer tank reservoir and then pumped through two sand filters (Hayward® 100 lb), followed by a UV sterilizer and cartridge filter to remove fine solids. Next water is pumped through a series of three moving bed bioreactors, each containing plastic extruded floating media (AMB Bio Media®) for biofiltration. Water then flows to a transfer tank and pumped through a series of three Vigilant Oil Eliminator® cartridge oil filters and finally through a carbon filter to remove any organics remaining in the water. After the carbon filter, water flows into a clean water transfer tank and is pumped indoors to two large (5300 L each) clean water storage tanks, which ensures that adequate water volume is available to gravity feed water to the experimental exposure tanks.
Experimental System Testing
Before, during and after the experimental trials, water quality, water chemistry and oil contaminant concentrations are monitored. Daily water quality measurements are recorded. Dissolved oxygen and temperature is monitored with a YSI ProODO optical dissolved oxygen meter, salinity is monitored with a refractometer and pH is monitored with a VWR Symphony SP70P portable pH meter. Ammonia and nitrite concentration is monitored daily or weekly depending on the length of the trial. Changes in the concentrations of targeted oil contaminants, such as total polycyclic aromatic hydrocarbons (tPAH; USDOC, NOAA, 2011) are measured periodically throughout the system during exposure trials and/or in the exposure tanks to ensure that the system is meeting the design parameters.
Results and Discussion:
Over the past three years, numerous trials have been completed in the Aquaculture Ecosystem Health Research System (AEHRS). These trials provided key findings that allowed us to evaluate the performance of the system under different types of exposure scenarios and to make improvements in the system design. In this paper, we report results pertaining to system performance (water quality, water chemistry, contaminant levels) from three different types of exposure trials:
- Oil contaminated diet exposure trial
- Dispersed oil exposure trial
- Dispersed oil uptake and depuration trial
In the oil contaminated diet exposure trial, sub-adult red drum (9 fish per tank) were placed in the exposure tanks and fed an oil contaminated standard marine fish grower diet (low oil contaminated diet = 54 g oil/kg feed; high concentration = 91 g oil/kg feed) and control diets (no oil) over a 14-day period. In the dispersed oil exposure trial, adult pompano (5 fish per tank) were placed in the exposure tanks and received two spike exposures to dispersed oil, followed by declining exposure (returning to clean seawater over a 12 hour time period) over a 5-day period. In the dispersed oil uptake and depuration trial, sub-adult red drum (30 fish per tank) were continuously exposed to test solutions over a 4-day period, followed by a 6-day depuration period in the exposure tanks in clean, filtered water.
Water Quality Monitoring
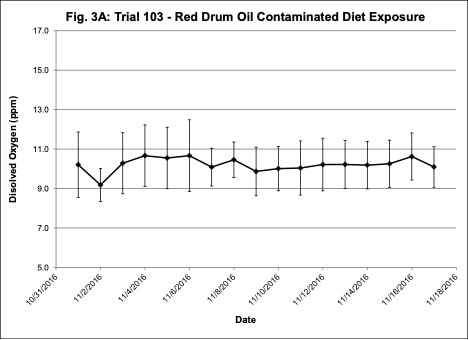
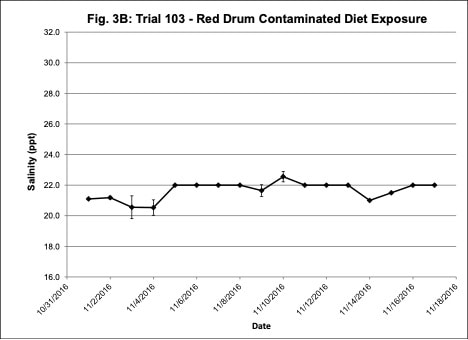
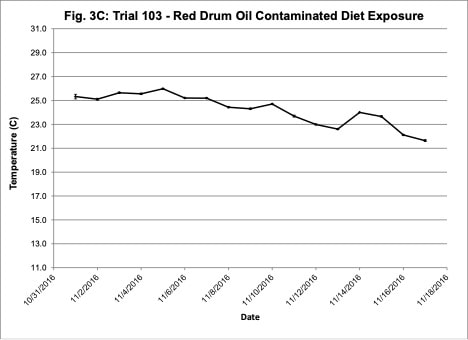
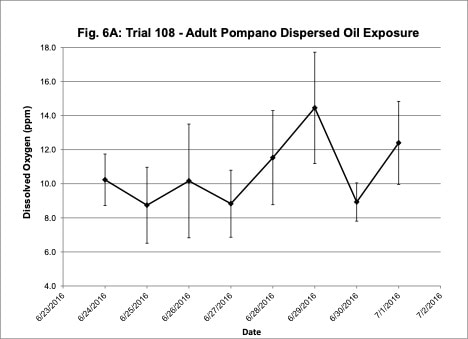
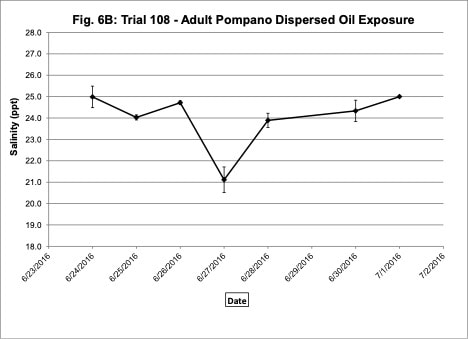
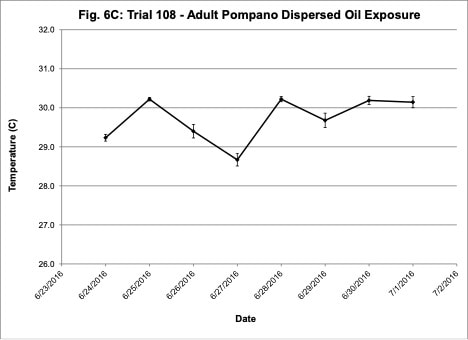
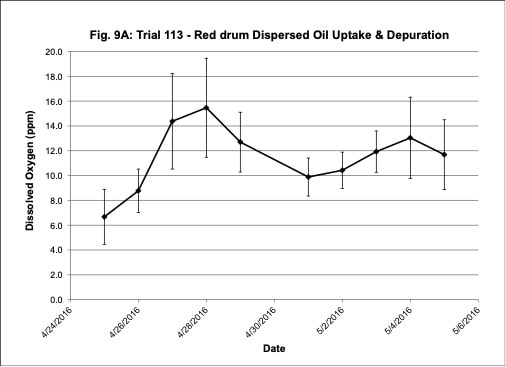
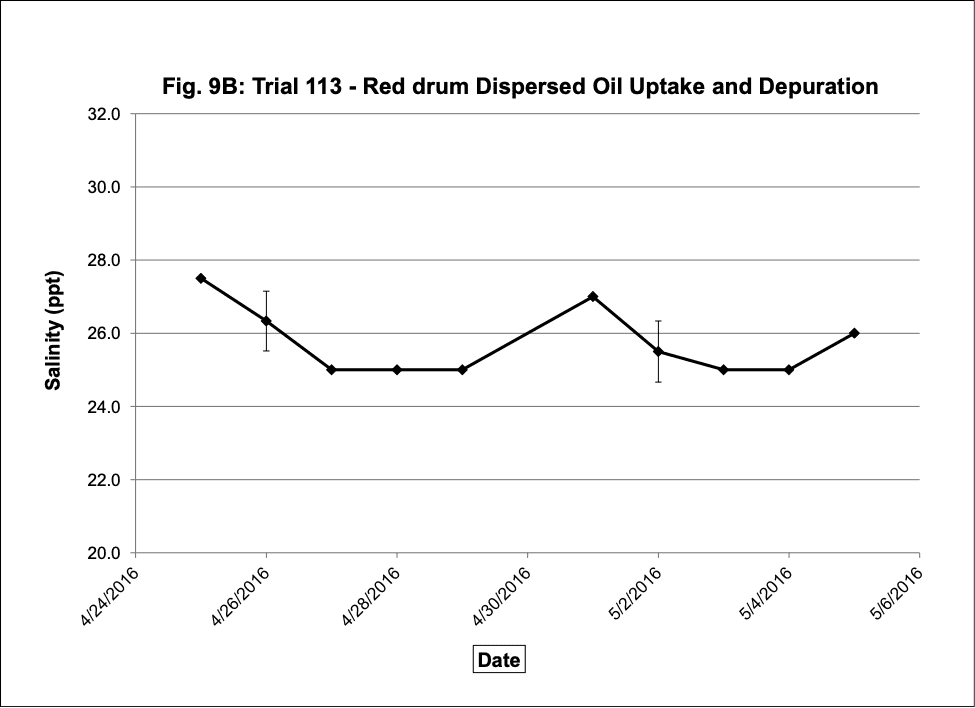
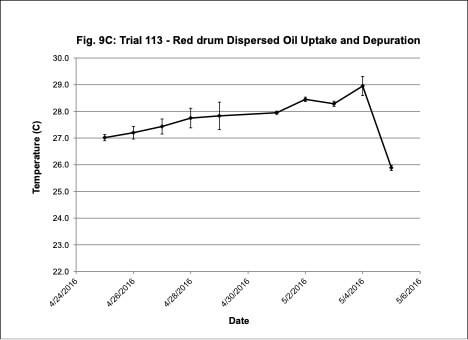
Water quality was monitored daily throughout the three experimental trials and dissolved oxygen was adjusted as needed to ensure that oxygen concentrations were maintained at appropriate levels. In the oil contaminated diet exposure (Trial 103) and the pompano dispersed oil exposure (Trial 108) trials, dissolved oxygen (DO) concentration ranged from 9.2-10.7 ppm (Figure 3A) and 8.7-14.5 ppm (Figure 6A), respectively. Following this trial, we upgraded the oxygen flowmeters to a meter that had a finer adjustment valve, which allowed us to keep all the replicate exposure tanks stable. During Trial 103, salinity was stable and ranged from 21-22.6 ppt (Figure 3B). During Trial 103, the heat/chill exchange system had not been installed and temperatures ranged from 22.1-25.6oC (Figure 3C). However, the temperature did not vary significantly between the replicate treatment and control tanks and the overall temperature variation over the 14-day trial only varied 3oC. Salinity and temperature were stable throughout Trial 108, with salinity ranging from 21-25 ppt (Figure 6B) and temperature ranging from 28.7-30.2oC (Figure 6C). In the dispersed oil uptake and depuration trial (Trial 113), DO ranged from 6.7-15.5 ppm (Figure 9A). Although DO levels did increase to 15.5 ppm on the last day of the uptake portion of the trial, concentrations in the replicate exposure tanks were stable. Salinity and temperature were stable throughout this trial with salinity ranging from 25-27.5 ppt (Figure 9B) and temperature ranging from 25.9-29oC (Figure 9C). Although there were some variations in the water quality parameter concentrations (DO, salinity, temperature) during the different exposure trials, these variations were all well within appropriate water quality concentrations for red drum and pompano.
Water Chemistry and Contaminant Monitoring
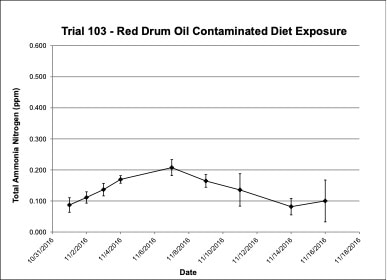
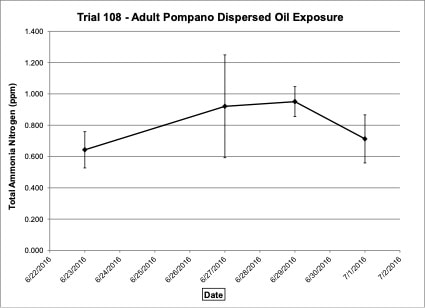
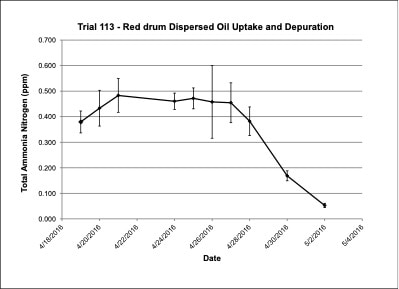
Water chemistry was monitored periodically throughout the experimental trials. Ammonia-nitrogen (NH3-N) and Nitrite-nitrogen (NO2-N) levels were within appropriate concentrations for marine fish. Ammonia-nitrogen ranged from 0.09-0.20 ppm in Trial 103, from 0.64-0.95 ppm in Trial 108 and from 0.05-0.48 ppm in Trial 113 (Figures 4, 7, 10). Nitrite-nitrogen ranged from 0.01-0.02 ppm in all three trials.
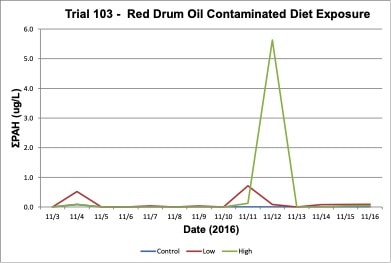
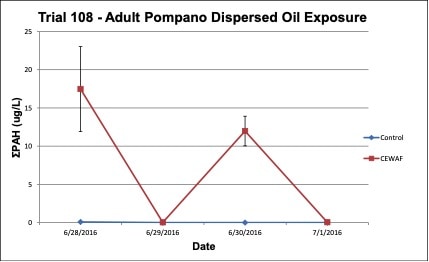
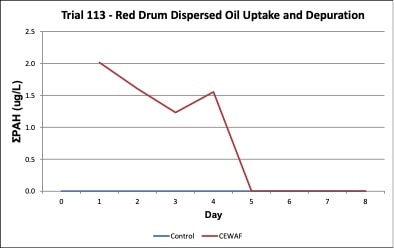
Oil concentrations were measured in the exposure treatment and control tanks during the three exposure trials. In the Trial 103 trial, increases in tPAH (ug/L) occurred in the water due to leaching of oil contaminants into the exposure tank water and tPAH was not present in the control tanks (Figure 5). In the Trial 108, high concentrations of tPAH (12-18 ug/L) were detected following the two spike exposures of dispersed oil test solutions, but the tPAH concentration dropped below the method detection limit (MDL) the day after the exposure occurred; tPAH was not present in the control tanks (Figure 8). In the Trial 11, concentrations of tPAH ranged from 1-2 ug/L and then dropped below the MDL during the depuration period; tPAH was not present in the control tanks (Figure 11). In all three trials, tPAH levels were below MDL in the control tanks (Figures 5, 8, 11).
The efficiency of the filtration system in removing oil contaminants was measured at various points through the exposure and filtration system. The data in Table 1 shows changes in tPAH concentrations and documents that the filtration system removed the oil contaminants following the dispersed oil contamination spikes to a concentration below MDL.
Fish Performance
Experimental trials were conducted using the exposure system with three important Gulf of Mexico marine fishes, Florida pompano (Trachinotus carolinus), red drum (Sciaenops ocellatus) and Southern Flounder (Paralichthys lethostigma). These trials lasted from 7 to 30 days and examined the impacts of dispersed oil exposure on facets of fish health including: gene expression, transcriptome, immune function, DNA damage, shifts in the microbiome, reproductive potential and success, and the F1 generation from exposed parents.
The three species that were tested in the system varied in activity levels from highly active (Florida pompano), to moderately active (red drum), to low activity (Southern flounder). The numbers of fish included in the exposure trials were adjusted, based on size and activity level, to ensure that the system could support oxygen requirements and to maintain appropriate water chemistry during the trials. Improvements in oxygen delivery, temperature control and water flow were implemented during the system operation trials, which improved the system performance. The water quality, water chemistry and other life support requirements of three marine fish tested was successfully supported in the Aquaculture Ecosystem Health Research System. In addition, oil contaminants were successfully removed by the filtration system.
Acknowledgments
The authors thank the staff at Complete Water Services, LLC, for engineering support and for securing equipment that was incorporated into the AEHRS. We also thank the following Mote Marine Laboratory staff: Dr. Nicole Rhody, Matthew Resley, Christelle Miller and Rebecca Medvecky for maintaining the fish and collecting data to support this system evaluation. This work was supported by a grant to C-IMAGE (Center for Integrating Modeling and Analysis of the Gulf Ecosystem) from the Gulf of Mexico Research Initiative (GoMRI).
Corresponding Author:
Kevan L. Main
Directory of Fisheries & Aquaculture
Mote Marine Laboratory
1600 Ken Thompson Parkway
Sarasota FL 34236
Email: kmain@mote.org
References:
Aas, E., Baussant, T., Balk, L., Liewenborg, B., Andersen, O.K. 2000. PAH metabolites in bile cytochrome P4501A and DNA adducts as environmental risk parameters for chronic oil exposure: a laboratory experiment with Atlantic cod. Aquatic Toxicology 51(2000): 241-258.
Briant, H.G., Stephens, A., Ralston, E., Hunsucker, K.Z., Swain, G. 2017. An effective mesocosm design for studying the settlement and recruitment of fouling organisms. Marine Technology Society Journal 51(2): 31-38.
Boxman, S.E., Kruglick, A., McCarthy, B., Brennan, N.P., Nystrom, M., Ergas, S.J., Hanson, T., Main, K.L., Trotz, M.A. 2015. Performance evaluation of a commercial land-based integrated multi-trophic aquaculture system using constructed wetlands and geotextile bags for solids treatment. Aquacultural Engineering 69: 23-36.
Calisi, R.M. & Bentley, G.E. 2009. Lab and field experiments: Are they the same animal? Hormones & Behavior 56(1):1-10.
Varanasi, U. 1989. Metabolism of polycyclic aromatic hydrocarbons in the aquatic environment. CRC Press, Boca Raton, FL.
USDOC, NOAA. 2011. Analytical quality assurance plan. Mississippi Canyon 252 (Deepwater Horizon) natural resource damage assessment. Version 3.0. Retrieved from: http://gulfresearchinitiative.org/wp-content/uploads/MC-252-Analytical-QAP-V3-0.pdf
Figures & Tables
Figure 1. Diagram of Aquaculture Ecosystem Health Research System (AEHRS) for exposure of adult marine fish to varying concentrations of crude oil. Three replicate systems (3 tanks per system) are connected to the water filtration system in Figure 2.
Figure 2. Diagram of Aquaculture Ecosystem Health Research System (AEHRS) water filtration system, which is connected to the exposure test system in Figure 1.
Figure 3. Change in water quality concentrations (Dissolved oxygen – ppm, Salinity – ppt, Temperature – oC; +/- standard deviation) during Red drum oil contaminated diet exposure Trial #103.
Figure 4. Change in ammonia-nitrogen (NH3-N) concentrations (+/- standard deviation) in tank water during Red drum oil contaminated diet exposure Trial #103.
Figure 5. Change in treatment (high and low) and control tPAH concentrations in tank water during Red drum oil contaminated diet exposure Trial #103.
Figure 6. Change in water quality concentrations (Dissolved oxygen – ppm, Salinity – ppt, Temperature – oC; +/- standard deviation) during adult Pompano dispersed oil exposure Trial #108.
Figure 7. Change in ammonia-nitrogen (NH3-N) concentrations (+/- standard deviation) in tank water during adult Pompano dispersed oil exposure Trial #108.
Figure 8. Change in treatment (CEWAF) and control tPAH concentrations (+/- standard deviation) in tank water during the adult Pompano dispersed oil exposure trial #108.
Figure 9. Change in water quality concentrations (Dissolved oxygen – ppm, Salinity – ppt, Temperature – oC; +/- standard deviation) during the red drum dispersed oil uptake and depuration exposure trial #113.
Figure 10. Change in ammonia-nitrogen (NH3-N) concentrations (+/- standard deviation) in tank water during the red drum dispersed oil uptake and depuration exposure trial #113.
Figure 11. Change in treatment and control tPAH concentrations in tank water during the red drum dispersed oil uptake and depuration exposure trial #113. Days 1-4 = uptake/exposure period to CEWAF; Days 5-10 = depuration period.
| Sample Location | tPAH before CEWAF | tPAH during CEWAF | tPAH after CEWAF |
|---|---|---|---|
| Mixing Reservoir | N/A | 11.6 ug/L | N/A |
| Treatment Tank | 0.01 ug/L * | 9.8 ug/L | 0.01 ug/L * |
| Collection Sump | 0.01 ug/L * | N/A | 0.02 ug/L * |
| After Foam Fractionator | 0.01 ug/L * | N/A | 0.01 ug/L * |
| Before Biofilter | 0.04 ug/L * | N/A | 0.01 ug/L * |
| Transfer Tank #2 | 0.05 ug/L * | N/A | 1.23 ug/L |
| Clean Water Transfer Tank | 0.05 ug/L * | N/A | 0.01 ug/L * |
| Clean Water Storage | 0.05 ug/L * | N/A | 0.08 ug/L * |
* Concentration below Method Detection Limit (MDL)
Table 1. tPAH concentrations (ug/L) at sampling points in the AEHRS exposure and filtration system (see Figures 1 and 2).
